
The Quiet Language of Your Wearable
Wearable technology has become so familiar that it is easy to overlook how extraordinary it really is. A watch that once did little more than tell time may now follow your heart rate through the night, estimate how deeply you slept, count the minutes you spent exercising, and offer an opinion about how well prepared your body is for the day ahead. Smart rings and fitness trackers gather much of the same information, quietly collecting signals while you walk, work, exercise, cook, sleep, and move through the ordinary rhythms of daily life.
Millions of people now wear these devices simply because they want to know more about their own bodies, and with a glance or a swipe, a wearable can offer an impressive amount of detail: heart rate, sleep, steps, heart rate variability, blood oxygen, stress, calories, VO₂ max, recovery. The graphs are colorful and the numbers update constantly, yet the meaning behind them often stays just out of reach, and the gap between seeing a number and understanding it is exactly where most people get stuck.
This is not a guide to choosing between an Apple Watch, Garmin, Fitbit, Samsung Galaxy Watch, Oura Ring, WHOOP, Polar, COROS, Suunto, or any other device. Although the names, features, and displays differ, most consumer wearables are drawing from the same underlying physiology. What changes from brand to brand is often the way those signals are gathered, combined, interpreted, and presented.
The more important question is what those signals represent in the first place. Once the language becomes familiar, the numbers begin to feel less mysterious, and the device becomes easier to use without allowing it to become the final authority on your health.
Two Different Kinds of Information
Before looking at the individual metrics, it helps to recognize that your wearable is giving you two fundamentally different kinds of information. Treating them as though they carry the same degree of certainty is where much of the confusion begins.
Some measurements come relatively directly from the sensors built into the device. Tiny lights detect changes in blood flow, motion sensors register acceleration as your arm and body move through space, temperature sensors record the warmth of the skin beneath the device, and, on certain watches, an electrical circuit can even capture a simplified tracing of the heart’s rhythm. These are the closest thing your wearable offers to raw data, the physiological equivalent of a photograph rather than a painting. Direct measurements—heart rate, movement, blood oxygen on supported devices, skin temperature, and single-lead ECG readings—tend to rest on decades of scientific study, and because there's comparatively little interpretation standing between the sensor and the number on your screen, they're generally the most trustworthy figures your device offers.
Other measurements are calculated, which is a very different process. A sleep score, a stress score, a readiness or recovery number, an estimated VO₂ max, a calorie count, a fitness age—none of these exist as a signal your body produces. Instead, a manufacturer's engineering team decides which raw signals matter, assigns each one a weight, and runs them through a proprietary algorithmic formula to produce a single tidy output.
The distinction between these two types of measurements is similar to the difference between an observation and an interpretation. One records what the sensors detected and the other attempts to explain what those signals may mean when considered together. This is why two devices worn by the same person on the same night may report different sleep or recovery scores. Both may have recorded similar heart rate, movement, and temperature patterns, yet the manufacturers’ algorithms may value those inputs differently. Neither score is necessarily false. They are simply two interpretations of the same body.
Keeping that difference in mind changes the way the entire device comes into focus. A directly measured signal may deserve a reasonable degree of confidence. A calculated score is better approached with interest, context, and a little humility about the precision of the final number.
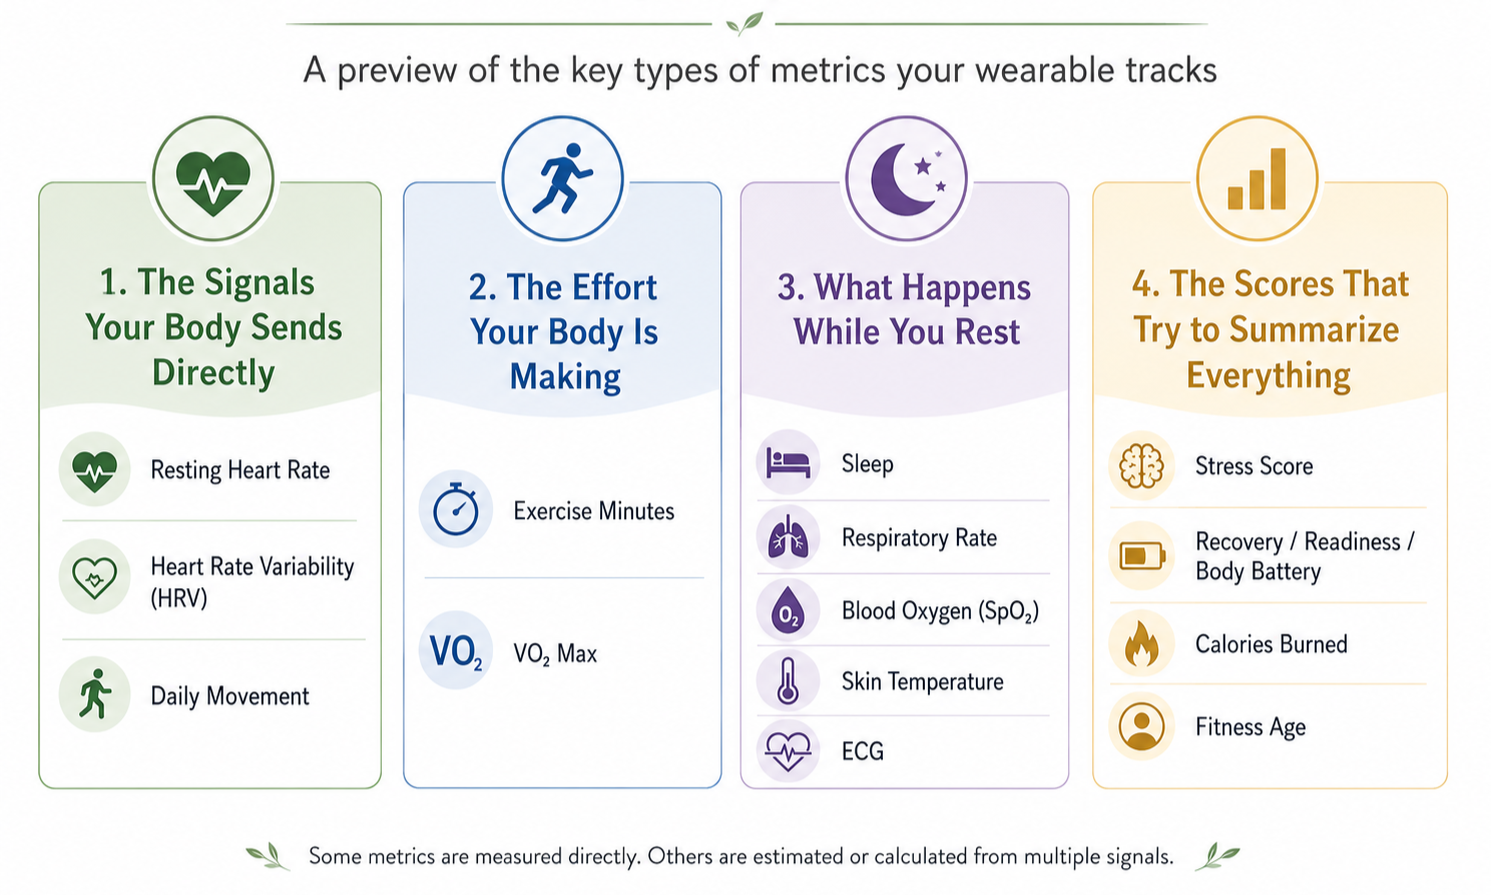
The Signals Your Body Sends Directly
Resting Heart Rate (RHR)
Resting heart rate is a useful place to begin because it has been observed and studied for far longer than wearable technology has existed.
Physicians have relied on pulse as one of the body’s basic vital signs for generations, and the number displayed on your watch is an updated version of that familiar measurement. It describes how many times the heart contracts in one minute while the body is genuinely at rest. Rather than asking you to sit quietly and take your pulse, most wearables identify this value by examining long periods—often during sleep—when movement is minimal and the heart rate remains low and stable. The measurement is usually gathered through photoplethysmography, or PPG, which sounds complicated, but the principle behind it is not. Small green lights on the underside of the device shine into the skin, while an optical sensor watches for tiny changes in the amount of blood moving through the capillaries with each heartbeat. Because hemoglobin absorbs green light particularly well, the rhythmic rise and fall in blood volume becomes visible to the sensor as a repeating pulse. From thousands of these pulses gathered throughout the day and night, the device identifies the periods when the heart appears to be working at its quietest and uses them to calculate a resting value.
A rate between 60 and 100 beats per minute is generally considered typical for adults, although that broad range is better understood as a clinical reference than a target everyone should try to reach. People who exercise regularly may have resting rates in the 40s or 50s because a well-conditioned heart often pumps more blood with each contraction. That greater stroke volume allows it to circulate the same amount of oxygen with fewer beats. Decades of population research have connected resting heart rate with cardiovascular fitness, heart health, and overall mortality risk. The number alone does not diagnose a problem, and a lower rate is not automatically better in every circumstance. Its value lies in what it reflects about the heart’s workload and efficiency.
Of all the information a wearable collects, resting heart rate is among the most dependable. Optical sensors tend to perform especially well during sleep and quiet rest, when motion is less likely to interfere with the signal. Accuracy becomes less consistent during vigorous exercise or activities involving substantial wrist movement, but under resting conditions, many modern devices compare favorably with clinical measurements.
Heart Rate Variability (HRV)
Heart rate variability, usually shortened to HRV, asks a quieter question than resting heart rate does.
Instead of measuring how fast the heart is beating, it looks at the tiny differences in timing between one heartbeat and the next. A heart beating 60 times per minute does not usually beat at perfectly even one-second intervals. One beat may arrive a fraction earlier, the next a fraction later, with the differences measured in milliseconds. This variability is not a flaw in the heart’s rhythm. It reflects the constant adjustments being made by the autonomic nervous system, the part of the nervous system that regulates functions such as heart rate, digestion, blood pressure, and breathing without requiring conscious direction.
The autonomic nervous system works through two complementary branches. The sympathetic branch prepares the body to meet effort, demand, or stress, while the parasympathetic branch supports rest, digestion, and recovery. Good health depends partly on the body’s ability to move between them as circumstances change. HRV offers one way of observing that flexibility. Greater beat-to-beat variation (a higher HRV) is often associated with stronger parasympathetic influence and a nervous system that can adapt readily. Lower variability may appear when the body is under greater physiological demand. This is one reason HRV has become an important measurement in cardiology, exercise physiology, sports science, and research on stress and recovery.
In a clinical setting, HRV is measured with an electrocardiogram, which records the electrical activity of the heart with exceptional precision. Most consumer wearables approximate it through optical pulse measurements, using the timing between successive waves of blood flow rather than the timing between the heart’s electrical signals. That approach works reasonably well while the body is still, which is why most devices measure HRV during sleep or quiet periods rather than continuously during activity. Movement introduces noise into the signal and makes the tiny differences between beats harder to distinguish.
HRV is also one of the least useful metrics for comparison between people. Age, genetics, physical fitness, medications, hormones, illness, and many other variables influence an individual’s range. A value that is typical for one person may be unusually high or low for another, therefore making your personal pattern more meaningful than a population chart or another person’s number.
Daily Movement
Daily movement is far less mysterious than HRV, yet its simplicity should not be mistaken for insignificance.
Steps, distance, walking pace, cadence, floors climbed, and time spent moving all begin with the same basic question: how much does your body move through the course of an ordinary day? Most wearables answer that question with accelerometers, sometimes supported by gyroscopes and GPS. Accelerometers detect changes in speed and direction across several planes of movement. Pattern-recognition software then looks for the familiar rhythm of walking or running and translates those repeated motions into a step count, distance estimate, or pace.
This process is generally accurate during ordinary walking, particularly when the arms move naturally. It becomes less precise when arm movement and leg movement no longer match. Pushing a shopping cart, walking while holding a railing, or using trekking poles may cause a device to miss steps. Repetitive hand and arm movements unrelated to walking can occasionally add steps that never occurred. Those limitations matter far less however than the broader pattern the metric reveals.
Daily movement may not carry the technical appeal of a recovery score or VO₂ max estimate, but decades of research have linked regular activity with lower risks of cardiovascular disease, type 2 diabetes, osteoporosis, certain cancers, cognitive decline, loss of physical function, and premature death. The value appears to come not only from formal exercise but also from avoiding long, uninterrupted periods of stillness. Walking through the house, gardening, carrying groceries, climbing stairs, and moving between daily tasks may not feel like exercise, yet together they create a more active life. Wearables make that accumulated movement visible in a way that memory and perception often cannot.
The Effort Your Body Is Making
Exercise Minutes
A step count records movement, but it does not tell you how demanding that movement was.
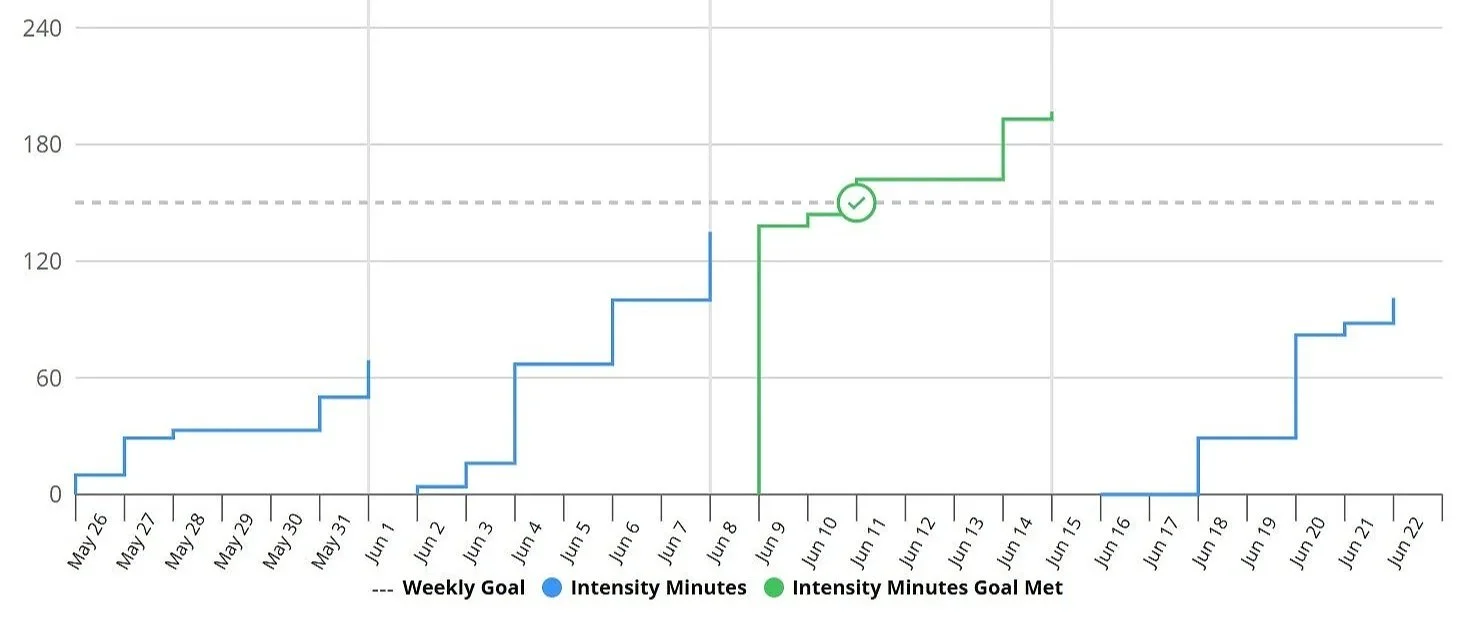
A slow walk through a store and a brisk climb up a steep hill may add a similar number of steps while placing very different demands on the heart, lungs, and muscles. So exercise minutes—sometimes labeled Active Minutes or Intensity Minutes—attempt to distinguish ordinary movement from activity vigorous enough to challenge the cardiovascular system. Most devices use some combination of heart rate, pace, motion, and duration to decide when an activity has crossed into a moderate or vigorous range.
This calculation is tied to long-established public-health recommendations. Adults are generally encouraged to accumulate about 150 minutes of moderate aerobic activity each week, 75 minutes of vigorous activity, or a combination of the two. These guidelines grew from decades of evidence connecting regular moderate-to-vigorous activity with lower risks of cardiovascular disease, diabetes, certain cancers, depression, and premature death.
Your wearable estimates this by blending heart rate, movement, pace, and duration, essentially asking whether your heart rate has climbed into a zone associated with real cardiovascular demand and whether it has stayed there long enough to count. This tends to work reasonably well for walking, running, and cycling, where heart rate rises and falls in a fairly predictable relationship with effort. It becomes considerably less reliable during resistance training, yoga, or interval work, where heart rate can lag behind actual effort, spike from breath-holding rather than aerobic demand, or simply not reflect the muscular work being done, which is worth remembering before assuming a hard strength session "didn't count" just because the exercise-minutes total looked unimpressive afterward.
VO₂ Max
VO₂ max reaches beyond the amount of activity performed and attempts to estimate how effectively the body uses oxygen during intense exertion.
The term refers to the maximum volume of oxygen the body can take in, transport through the bloodstream, and use in the working muscles, usually expressed in milliliters of oxygen per kilogram of body weight per minute. Exercise physiologists have long treated this as one of the single best overall indicators of cardiorespiratory fitness, because it reflects the entire chain of systems that has to work well together for your body to use oxygen efficiently under demand: how much air your lungs can move, how much blood your heart can pump with each contraction, and how efficiently your muscles can extract and use the oxygen once it arrives. Higher cardiorespiratory fitness has been consistently associated with lower risks of cardiovascular disease, metabolic illness, loss of physical independence, and premature death.
In a laboratory, VO₂ max is measured directly while a person exercises at increasing intensity, usually to near exhaustion, while wearing a mask that analyzes oxygen and carbon dioxide in every breath. A watch cannot measure gas exchange, so it must build a mathematical estimate from indirect clues: heart rate, pace, speed, elevation, age, sex, and previous activity data may all contribute to the estimate. Some devices require a certain amount of outdoor walking or running before producing a number because they need enough information to compare heart-rate response with actual workload.
The result is less precise than a laboratory test, but modern estimates can still reflect meaningful changes in fitness. As with many calculated wearable metrics, the broader direction over time tends to carry more weight than the apparent precision of a single reading.
What Happens While You Rest
Sleep
Sleep may be the area where wearables have captured the most attention, and understandably so, since sleep sits alongside nutrition and movement as one of the true foundations of health, touching cardiovascular function, immune response, metabolism, memory consolidation, mood, and physical recovery all at once.
Most devices attempt to reconstruct the night from several signals at once to estimate total sleep time, time awake, and time spent in light, deep, and rapid eye movement—or REM—sleep. Many also record overnight heart rate, HRV, breathing rate, blood oxygen, and skin temperature before combining some or all of those measurements into a sleep score.
The difficulty is that sleep is fundamentally a process of the brain, and a wearable cannot directly measure brain activity like in a clinical sleep study where electrodes placed on the scalp record brain waves through an electroencephalogram. Eye movements, muscle activity, heart rhythm, oxygen levels, and breathing are also monitored, allowing technicians to distinguish one sleep stage from another with far greater confidence. A watch or ring works entirely from proxies: it notices when the body becomes still, when the heart rate slows, when breathing settles into a regular pattern, and when HRV shifts in ways often associated with rest. From that collection of signals, an algorithm estimates whether the person is awake or asleep and which sleep stage is most likely occurring.
Deep sleep, when nearly all of this data points toward complete stillness and a suppressed, steady heart rate, tends to be estimated with reasonable confidence. REM sleep, which paradoxically involves brain activity resembling wakefulness alongside temporary paralysis of the major muscles, is a harder pattern to infer from movement and heart signals alone, and light sleep essentially becomes whatever is left over once deep and REM have been estimated, which means it absorbs the most error.
Total sleep duration and general sleep timing are usually the more dependable parts of the report because distinguishing sustained stillness from daytime activity is comparatively straightforward. The sleep score is a unique metric because each manufacturer decides how to balance sleep duration, consistency, interruptions, sleep stages, overnight heart rate, HRV, and other signals. A score of 78 on one device and 85 on another does not necessarily mean one device is more accurate. The two algorithms may simply define a “good” night differently.
Sleep matters enormously to cardiovascular health, metabolism, immune function, memory, mood, and physical recovery and the science supporting the importance of sleep is strong. As the precision of a wearable’s stage-by-stage reconstruction is more limited, what tends to be more useful than any individual score is watching your own duration, consistency, and overnight heart rate and HRV trends across weeks, since your own baseline, tracked against itself, tells you more than any cross-brand comparison ever could.
Respiratory Rate
Respiratory rate is the number of breaths taken each minute.
For a healthy adult at rest, the number often falls between 12 and 20 breaths per minute, although individual patterns vary. Compared with heart rate, respiratory rate tends to remain relatively steady from one night to the next. That stability is part of what makes it so useful. A metric that normally changes very little may become more noticeable when it begins to shift over several nights.
Most wearables do not count breaths through a dedicated airflow sensor. Instead, they estimate breathing rate during sleep by examining subtle rhythmic changes in heart rate, HRV, and body movement. Because breathing is generally more regular at night, the sleeping period offers the clearest opportunity to make that estimate. Respiratory infections, altitude, asthma, certain heart or lung conditions, medications, and significant physical strain may all affect breathing rate. A wearable cannot determine the cause of a change, but the measurement itself rests on a familiar and long-established vital sign.
Blood Oxygen (SpO₂)
Blood oxygen saturation estimates the percentage of hemoglobin carrying oxygen through the bloodstream.
In healthy adults near sea level, readings commonly fall between 95 and 100 percent. Wearables estimate this value with red and infrared light. Oxygen-rich and oxygen-poor hemoglobin absorb those wavelengths differently, allowing the sensor to calculate an approximate saturation level.
The same basic principle is found in fingertip pulse oximeters used in hospitals, although a consumer wearable at the wrist or finger may not match the performance of a medical device used under controlled conditions.
The measurement is particularly sensitive to circumstance, though: movement, cold skin, poor circulation, tattoos beneath the sensor, skin pigmentation, device position, and loose contact may all affect the reading. This helps explain why an isolated low number may appear even when nothing significant has changed physiologically. Blood oxygen can provide useful screening information, especially at altitude or when monitored under medical guidance. It should not be mistaken for a diagnosis, and a watch cannot replace clinical evaluation when symptoms or persistently abnormal readings are present.
Skin Temperature
Skin temperature tracking sounds as though it is measuring body temperature, but the distinction between the two is important because the sensor records the temperature of the skin directly beneath the device, not the body’s internal core temperature.
Skin temperature naturally changes with circadian rhythms and environmental conditions. Room temperature, bedding, clothing, alcohol consumption, travel, illness, exercise recovery, and the fit of the wearable can all influence the result. Hormonal changes across the menstrual cycle and during perimenopause and menopause may also be reflected in temperature patterns.
Because the measurement is so sensitive to context, manufacturers often use it as one ingredient in larger recovery or readiness calculations rather than treating it as a stand-alone health assessment. Its value lies less in whether the skin measured a particular temperature on one night and more in whether the pattern begins to differ from the device’s established baseline. It is also not a replacement for a thermometer when checking for fever.
Electrocardiogram (ECG)
A single-lead electrocardiogram is available on certain smartwatches and represents something categorically different from most optical measurements.
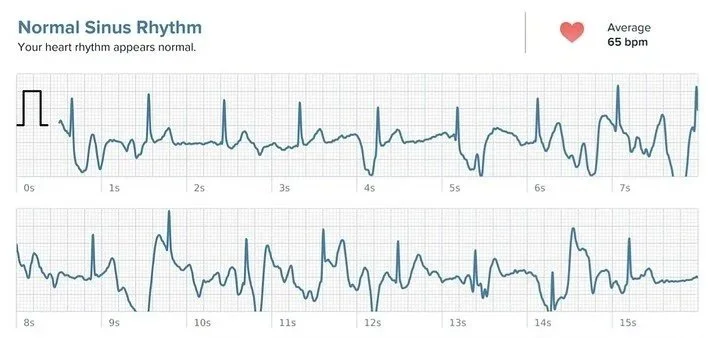
Rather than using light to infer changes in blood flow, it records the electrical signal that triggers each heartbeat. The wearer typically places a finger from the opposite hand against the watch, completing a small circuit that allows the device to capture a brief tracing. The principle is similar to the electrical recording used in clinical ECGs, although a medical 12-lead ECG gathers information from multiple positions across the body and provides a far more complete view of the heart’s electrical activity.
Several consumer devices have received regulatory clearance for identifying patterns consistent with atrial fibrillation, one of the most common heart-rhythm disorders and an important risk factor for stroke. For that narrow purpose, the technology can perform well. Its usefulness should not be confused with comprehensiveness. A single-lead wearable ECG cannot detect every rhythm abnormality, evaluate the heart’s structure, or replace a full medical assessment. It is a legitimate screening tool with a defined purpose, not a miniature cardiology department on the wrist.
On Numbers and Noise
At this point, the difference between the two types of measurements begins to matter more clearly. Resting heart rate and a stress score may appear side by side on the same device, displayed with equal confidence and visual polish, yet they are not offering the same kind of information. One begins with a detectable physiological signal and a measurement refined through decades of study. The other combines several signals through a manufacturer’s formula in an attempt to summarize something the device cannot observe directly. This does not make the calculated score useless. It simply changes the degree of certainty it deserves.
Wearable interfaces tend to flatten these distinctions. Every metric arrives in the same clean font, occupies its own screen, and updates with the same apparent authority. Understanding where a number comes from restores the context that the display removes. It becomes easier to separate signal from interpretation, and useful information from noise.
The Scores That Try to Summarize Everything
Stress Score
A stress score estimates physiological activation, which is not quite the same thing as emotional stress.
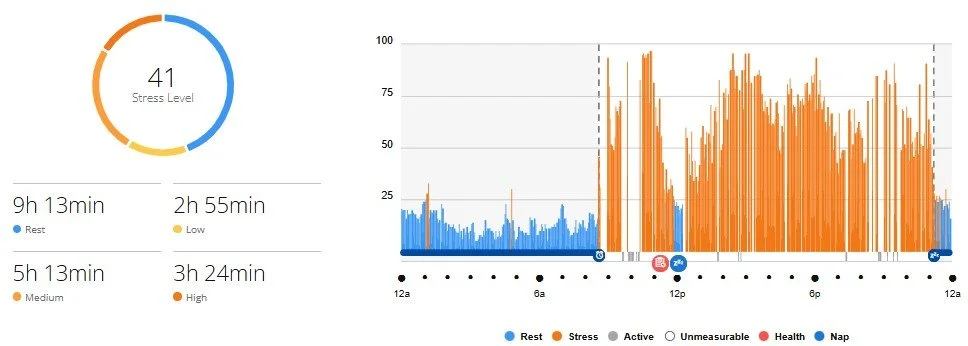
Emotional stress is part of your lived experience arising from worry, conflict, uncertainty, grief, or responsibilities that feel difficult to carry. A wearable has no direct access to that experience. It can only observe changes in the body. Most stress scores rely heavily on HRV, sometimes alongside heart rate, breathing patterns, and activity. When sympathetic nervous-system activity increases, HRV often narrows and heart rate may rise. The device recognizes that pattern and labels it as stress.
This means a wearable's stress score can climb just as readily from a difficult conversation or looming deadline as it can from a hard workout, illness, dehydration, excitement, poor sleep, or even a large dose of caffeine. The wearable is detecting physiological demand, not interpreting the meaning of the moment. It’s simply reading a physiological pattern, not your emotional experience of the day, and it has no way of distinguishing between a stressor that's genuinely taxing and one that's simply demanding in a way your body is well-equipped to handle. That limitation is not a failure of the technology. It is simply the boundary of what the sensors can know.
Recovery, Readiness, and Body Battery
Recovery scores, readiness scores, Training Readiness, and Body Battery use different names to approach a similar question: how recovered does the body appear to be, and how prepared might it be for further demand?
To answer it, manufacturers combine several measurements that may include HRV, resting heart rate, sleep duration, sleep stages, recent activity, exercise load, respiratory rate, and skin temperature. Each company chooses its own ingredients and determines how heavily each one should influence the final score.
The underlying individual measurements often have meaningful scientific support. Sleep, resting heart rate, HRV, and recent training load all relate in some way to recovery. The uncertainty lies in how they should be combined and whether one numerical score can adequately summarize the body’s readiness. Because the formulas are proprietary, the final number is difficult to validate independently and impossible to compare cleanly across brands. Its usefulness is therefore less about the absolute score and more about understanding that it is an organized interpretation of several other measurements, not a new physiological signal of its own.
Calories Burned
Calories burned may be one of the most familiar wearable metrics and one of the least precise.
Most devices divide energy expenditure into resting calories and active calories. Resting calories, sometimes called basal metabolic rate, estimate the energy required to maintain basic functions such as breathing, circulation, temperature regulation, and cellular activity while active calories estimate the additional energy used through movement and exercise.
Neither is directly measured by the wearable as they require far more specialized equipment to do so. In laboratory settings, researchers may analyze oxygen consumption and carbon dioxide production or use other controlled methods unavailable to a device worn during daily life. Instead, the device combines personal information—such as age, sex, height, and weight—with heart rate, movement, pace, GPS data, and exercise duration, then applies a mathematical formula to approximate energy use.
The difficulty is that two people of similar size may use different amounts of energy during the same activity because of differences in body composition, fitness, movement efficiency, hormones, medication, environment, and many other factors. Activities such as strength training add further complexity because the metabolic cost may not align neatly with heart rate or arm movement. Research has repeatedly found meaningful variation between devices and across different types of activity, which is worth keeping in mind if calorie totals are being used to inform decisions about food; these figures tend to be more useful as a rough, consistent trend from the same device over time than as a precise daily accounting.
Fitness Age
Fitness age translates an estimate of cardiorespiratory fitness into an age-based comparison.
A person whose estimated VO₂ max is above average for their chronological age may receive a younger fitness age, while a lower estimate may produce an older one. The intention is motivational. VO₂ max can feel abstract, while age is immediately understandable, so the device converts a complex fitness measurement into a form more likely to capture attention.
The result does not measure biological age, cellular aging, or the overall age of the body. It usually rests on estimated VO₂ max together with age, sex, activity level, and sometimes body composition. Different manufacturers use different comparison databases and formulas, which means the same person may receive different fitness ages from different devices. It is best understood as an educational interpretation of existing fitness information rather than a separate health metric.
Sitting With the Numbers
Wearable technology offers access to a remarkable amount of physiological information, but access is only the beginning. The numbers become genuinely useful when we understand what kind of information each one represents and how much confidence it deserves. You don't need to treat every score on your wearable as an instruction. You don't need to chase a perfect number, or feel that a lower readiness score on a Tuesday morning says something true about your worth or your discipline, particularly once you understand how much interpretation sits between the raw signal and the figure on your screen. What you need, more than anything else, is a little curiosity about your own patterns over time, alongside a clear enough understanding of what each number actually represents to know when it deserves real weight and when it's simply one company's best guess.
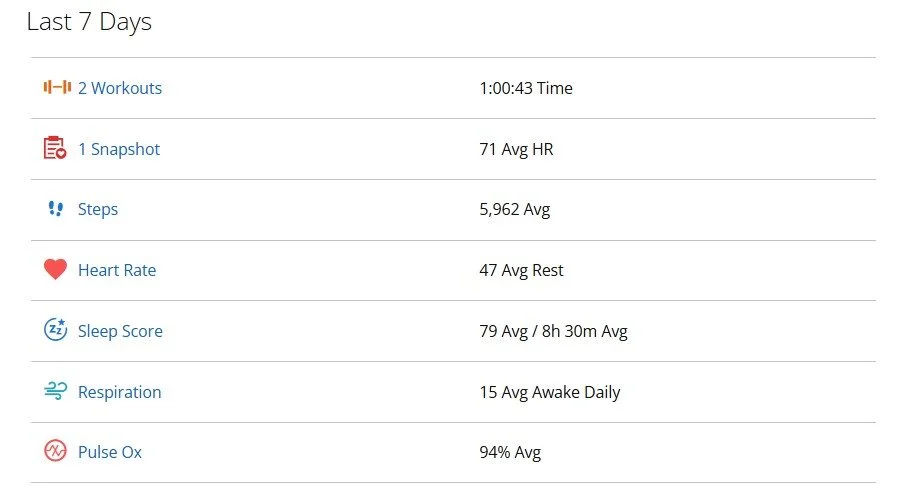
Understanding what a metric actually measures leads to trusting it appropriately. Trusting it appropriately leads to noticing your own patterns rather than chasing someone else's averages or another brand's algorithm. And noticing your own patterns, slowly, across weeks and months rather than any single morning, tends to lead to the kind of self-awareness no algorithm was ever really built to hand you in the first place.
That part still belongs to us.
Let’s get cooking!

Wearable data may help you notice patterns, but the kitchen is where many of your everyday health choices begin. Let those insights inspire meals that support steady energy, restorative sleep, and the strength to keep moving through your day.
Three Bean Salad
Colorful and tangy, Three Bean Salad combines a convenient pantry staple—canned beans—with crisp celery, red pepper, onion, and fresh parsley. Using canned beans makes this salad especially convenient, but it still offers a satisfying combination of fiber and plant-based protein, while the vegetables bring additional color, texture, and flavor to every serving.
The simple dressing combines apple cider vinegar, olive oil, Dijon mustard, celery seed, and just enough maple syrup or honey to soften the vinegar’s sharpness. Once tossed together, the salad rests in the refrigerator so make it several hours ahead—or even the day before serving—so the beans have time to absorb the dressing and the flavors can settle together.
Serve it alongside grilled chicken, fish, burgers, sandwiches, or roasted vegetables, or enjoy it as a light lunch with leafy greens and a little crumbled cheese.

Three Bean Salad
Ingredients
- 5 cups of cooked beans OR 3 cans (15 ounces) beans, drained well
- ½ cup diced celery
- ¼ cup diced bell pepper
- ⅓ cup finely diced red onion
- ¼ cup chopped fresh parsley or mixed herbs
- ¼ cup apple cider vinegar
- 3 tbsp extra-virgin olive oil
- 2 tbsp pure maple syrup or honey
- 1 tbsp Dijon mustard
- ½ tsp whole celery seed
- ½ tsp salt
- ¼ tsp black pepper
Instructions
- Place the drained beans, celery, bell pepper, red onion, and parsley in a large bowl.
- In a small bowl or jar, whisk together the apple cider vinegar, olive oil, maple syrup, Dijon mustard, celery seed, salt, and black pepper.
- Pour the dressing over the bean mixture and gently toss until everything is evenly coated.
- Cover and refrigerate for at least 2 hours, or preferably overnight, so the beans and vegetables can absorb the sweet-and-sour dressing.
- Stir well before serving. Taste and add a little more vinegar, maple syrup, salt, or pepper as needed.
Notes
- Drain the canned beans thoroughly so the salad does not become watery.
- Use whatever combination of beans you like or have on hand.
- Use red wine vinegar for a tangier dressing.
- The salad will keep in a covered container in the refrigerator for up to four days. The flavor becomes even better after it rests overnight.
Zucchini Banana Buckwheat Muffins
These Zucchini Banana Buckwheat Muffins are everything a wholesome muffin should be—moist, naturally sweet, and packed with nourishing ingredients that support steady energy throughout the day. Ripe bananas, shredded zucchini, and pure maple syrup create a tender crumb and subtle sweetness, while buckwheat flour adds a rich, earthy flavor and extra fiber to help keep you satisfied.
Chia seeds contribute plant-based omega-3 fats and additional fiber, while avocado oil provides heart-healthy monounsaturated fats that keep the muffins soft and moist without relying on butter. Warm cinnamon and chai spice give each bite a cozy, comforting flavor that's perfect for breakfast, an afternoon snack, or a healthy addition to lunch.
Don't let the zucchini fool you—it practically disappears into the batter, leaving behind moisture and nutrition rather than a vegetable flavor. Sweet-tart dried cranberries add little bursts of fruitiness that balance the warming spices beautifully.
These gluten-free muffins freeze well, making them an excellent meal-prep option for busy weeks. Pair one with Greek yogurt, cottage cheese, or a handful of nuts for a balanced breakfast, or enjoy one alongside your afternoon tea or coffee for a nourishing snack that satisfies without weighing you down.

Zucchini Banana Buckwheat Muffins
Ingredients
- 2/3 cup mashed very ripe banana
- 1/3 cup avocado oil
- 1/3 cup pure maple syrup
- 3 tbsp plain whole milk kefir (or 1/4 cup plain yogurt)
- 2 eggs
- 1 t vanilla
- 2 T chia seeds
- 1 cup buckwheat flour
- 1 cup gluten free flour
- 1 tsp baking soda
- 1 tsp chai spice (or additional cinnamon)
- 1 tsp cinnamon
- 1/4 tsp salt
- 2 cups shredded, squeezed dry zucchini
- 1/2 cup dried cranberries (or any dried fruit)
Instructions
- Preheat the oven to 375°F (190°C). Line a 12-cup muffin tin or lightly grease it.
- In a large bowl, whisk together the mashed banana, oil, syrup, kefir, eggs, vanilla until completely smooth.
- Stir in the chia seeds and let the wet mixture sit while assembling the dry ingredients.
- In a separate bowl, sift (or whisk) together the buckwheat flour, gluten free flour, baking soda, chai spice, cinnamon, and salt. Stir to evenly disperse the ingredients.
- Add the wet ingredients to the dry ingredients and gently stir until mostly combined.
- Add the zucchini and cranberries and gently stir until all ingredients are just blended.
- Let the batter sit undisturbed on the counter for 10 to 15 minutes to allow the flours to absorb the liquids.
- Divide the batter evenly into the muffin cups. They will be quite full.
- Bake for 20 - 22 minutes until lightly browned and a toothpick inserted in the center comes out clean.
- Let cool in the pan for 5 minutes before transferring to a wire rack to cool completely.
Notes
- These muffins freeze well, Freeze in a single layer on a baking sheet and transfer to a freezer bag squeezing out as much air as possible. Thaw in the microwave to enjoy.
- For mini muffins (yields 24 - 30) bake for 11 -13 minutes.
- For quick bread loaf lower the temperature to 350°F (175°C) and bake for 50 - 60 minutes.
There you have it!
As the information your wearable collects becomes more familiar, it may begin to feel less like a stream of numbers and more like a helpful companion. Use what it offers to make small, thoughtful choices that support your health and the life you want to keep living.